

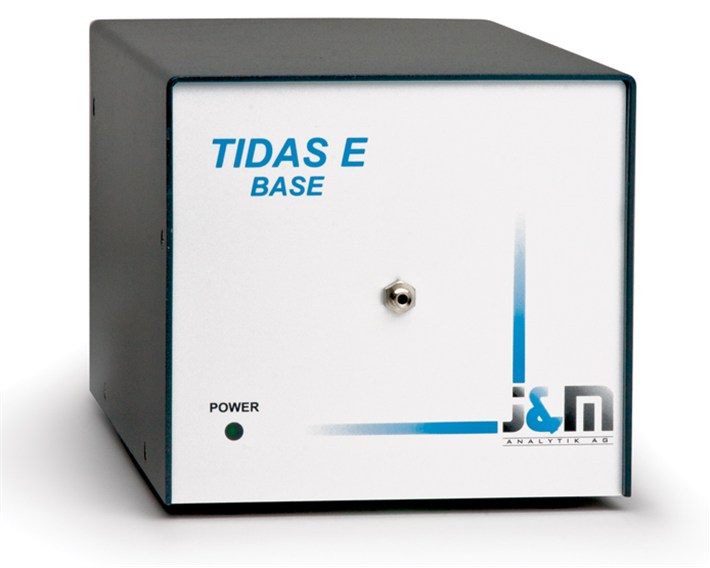
TIDAS-E
TIDAS-E Photo Diode Array Spectrometer- Overview
- Specifications
- Accessories
- Citations
- Related Products
Overview
There are 1 images available to view - click to enlarge and scroll through the product gallery.
- Low noise detection
- Wavelength range 190-720nm
- Fiber optic design
Details
WPI’s Tidas E is a high end fiber-optic spectrometer module designed for low noise applications. The Tidas E outperforms conventional bench-based spectrophotometers and CCD-based spectrometer modules, when it comes to high precision fiber optic sampling. It relies on a monolithic optical bench made by Zeiss, which is optimized for fiber optic applications. Most cuvette-based standard spectrometers lose more than 90% of light through expensive prism decoupling. The Tidas E is designed for fiber optic sampling cells. Using suitable light sources and sample cells, spectral detection in the wavelength range of 190 to 720 nm can be performed at noise levels < 0.04 mAU peak to peak.
Applications
The Tidas E is ideally suited for WPI’s fiber optic sampling equipment. High sensitivity detection systems for flow analysis can be assembled using WPI’s Liquid Waveguide Capillary Cells (LWCC) with effective pathlengths ranging from 50 to 500 cm. These setups are frequently used in fluid injection analysis systems for nutrient analysis (nitrite, nitrate, phosphate, iron) in oceanographic applications. Microliter sampling systems for UV/VIS applications can be assembled, using WPI’s V-Vette or DipTip™ dipping probes.
Software
There are separate software packages for data collection and data analysis for the Tidas E. An instrument driver, TIDASDAQ, is used to run the spectrometer module, collect spectra in either single or continuous mode, control the digital I/Os and save the experimental data to disk. Data analysis is performed with the SpectraView software package. Further, TIDASDAQ exports data directly into GRAMS/AI, a feature very useful for advanced data analysis for pharmaceutical applications and requirements.
TidasDAQ: Data Collection and Instrument Control
With TidasDAQ, high precision intensity, absorbance, transmittance or normalized spectra can be obtained in less than a second. Only a few parameters need to be adjusted to obtain spectral data. Sampling of single scans, continuous full spectra scans or triggered scans is possible. Chromatograms can be displayed and logged to disk at up to four wavelengths. Data Export of 2D and 3D Spectrograms, as well as Chromatograms is supported in ASCII, Spectralys/SpectraView, Excel and Grams/AI formats. Light sources and other sampling instrumentation can be controlled via the TTL level digital outputs, as well as data collection can be triggered by TTL leveled external inputs of the TIDAS E.

TIDASDAQ acquisition window, showing an absorbance baseline. Click on the image for a bigger picture.
SpectraView: Data Analysis
SpectraView is a spectroscopy data analysis package targeted at flow analysis applications. It processes data recorded by TIDASDAQ. SpectraView allows to display recorded spectra in 2D (default) and 3D view. Mathematical computation, Derivation, Smoothing, Quantification and other functions are available to work with your data. The Quantification module allows single point and multiple point analysis, multiple linear regression, partial least square and principle component analysis. Data can be exported out of a 3D analysis file into separate scans. Further, chromatograms as well as spectrograms can be copied directly into Excel for further data analysis.

SpectraView 3D view. Spectra can be displayed and analyzed in 2D and 3D format. This allows you to conveniently interpret “time acquisition” data typically done with a TIDAS-E-LWCC flow system. Click on the image for a bigger picture.
Specifications
| OPTICAL BASICS | Monolithic Spectrometer Module; Concave Aberration Corrected Holographic Grating; Fiber optic cross section converter for increased light throughput; 2nd order multilayer filter |
| DETECTOR ARRAY | Hamamatsu photodiode array, 256 pixel |
| WAVELENGTH RANGE: | 190 - 720nm |
| SPECTRAL BANDWIDTH (FWHM) | |
| DETECTOR RESOLUTION | 16 Bit |
| NOISE (PEAK TO PEAK)* | < 0.04mAU @ 254nm |
| WAVELENGTH ACCURACY | < 1nm |
| WAVELENGTH REPRODUCIBILITY | < 0.1nm |
| FIBER OPTIC INPUT | 600µm |
| SYSTEM REQUIREMENTS | Windows XP, Vista |
| SOFTWARE (INCLUDED) | TIDASDAQ (data collection) & SpectraView (data analysis) |
| DIMENSIONS (WxHxD) | 260 × 150 × 140mm (10.25 × 5.9 × 5.5") |
| WEIGHT | 2.5kg (5.5 lb) |
| INTERFACE | External (RJ-45) |
| POWER | 100-240V/50-60Hz |


Request
Catalogue
Chat
Print